
Semantic Modeling: The Missing Link Between Data Engineers and Business Users
Dara Bindara

1. Executive Summary
Enterprise data platforms have solved storage and compute scalability—but they have not solved understanding.
Raw tables, even when clean, are not usable for business users. The real bottleneck is not SQL—it’s semantic clarity.
Recommended approach / pattern
Implement a governed semantic modeling layer inside Snowflake that maps raw data into business-friendly entities, metrics, and relationships.
Where it fits (best use cases)
This architecture is particularly effective for:
- Organizations with complex data models (multiple schemas, domains)
- Teams struggling with inconsistent KPI definitions
- Enterprises scaling BI across multiple departments
- Platforms where business users depend heavily on analysts
Key outcomes
- Elimination of metric inconsistencies across teams
- Reduced dependency on analysts for interpretation
- Faster, more reliable decision-making
- Standardized business logic across BI tools
What the reader can implement
After reading this article, data engineers can implement:
- A semantic layer using Snowflake tables/views
- Business-mapped metrics (revenue, margin, retention)
- A governed data model aligned with business terminology
- Integration with BI tools (Power BI / Streamlit)
2. Background
Over the past decade, data engineering has focused heavily on data movement and storage.
We optimized pipelines.
We scaled warehouses.
We built dashboards.
But here’s the uncomfortable truth:
Most organizations still don’t trust their data.
Why?
Because “revenue” means different things to different teams.
Finance excludes discounts.
Sales includes gross value.
Marketing uses campaign-adjusted numbers.
Same data. Different answers.
This isn’t a data problem.
It’s a semantic problem.
Without a semantic layer:
- Raw tables are exposed to BI tools
- Analysts redefine logic repeatedly
- Metrics drift over time
- Trust collapses
Semantic modeling fixes this by introducing a single source of truth—not just for data, but for meaning.
3. Problem
3.1 Symptoms
Symptom 1 — Metric Inconsistency
Different teams calculate the same KPI differently.
Symptom 2 — Analyst Dependency
Business users cannot interpret raw tables without help.
Symptom 3 — Schema Complexity
Snowflake environments contain hundreds of tables with unclear relationships.
Symptom 4 — BI Chaos
Power BI / dashboards show conflicting numbers.
3.2 Impact
This isn’t cosmetic—it’s operational damage.
- Decisions are delayed because numbers are debated
- Analysts waste time redefining the same metrics
- Leadership loses trust in dashboards
- Data platform ROI drops significantly
If your CEO asks “Why are these numbers different?” and your team can’t answer instantly—you don’t have a data platform. You have a data mess.
4. Requirements & Assumptions
4.1 Data Characteristics & Operational Context
- Large-scale Snowflake environments (millions–billions of rows)
- Multi-layer architecture (Raw → Curated → Semantic)
- Data refreshed hourly/daily
- Multi-domain datasets (sales, finance, inventory, etc.)
Semantic modeling sits on top of curated data, not raw ingestion layers.
4.2 Security & Access Control
Semantic models must respect Snowflake RBAC:
- Business users query only authorized data
- No bypass of existing permissions
- Metrics inherit table-level security
This is non-negotiable—semantic layers must not become a backdoor.
4.3 Technology Stack
- Snowflake (core platform)
- Snowflake Views / Tables for semantic modeling
- dbt (optional but recommended)
- Streamlit / Power BI for consumption
4.4 System Constraints
Metric Explosion Problem
Uncontrolled semantic layers create hundreds of metrics → chaos again.
Governance Overhead
Without strict ownership, definitions drift.
5. Recommended Architecture
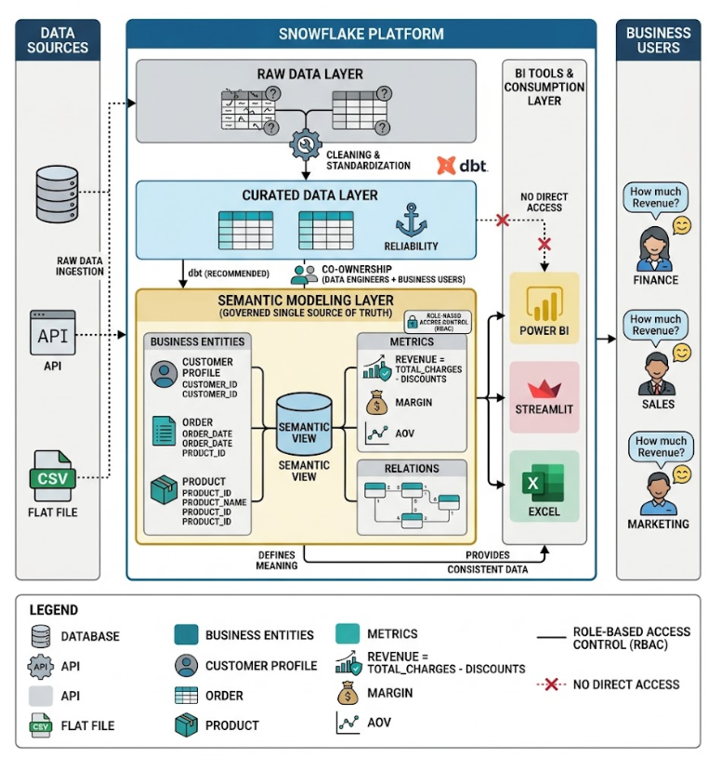
5.1 High-Level Flow
- Raw data ingested into Snowflake
- Curated layer cleans and standardizes data
- Semantic layer defines:
- Business entities (Customer, Order, Product)
- Metrics (Revenue, Margin, AOV)
- BI tools consume only semantic models
- Business users interact without touching raw tables
5.2 Architecture Diagram
5.3 Options
Option A — No Semantic Layer (Direct BI Access)
Advantages
- Faster initial setup
Disadvantages
- Metric inconsistency
- Analyst dependency
- No governance
Option B — Governed Semantic Layer (Recommended)
Advantages
- Consistent KPIs
- Business-friendly data access
- Strong governance
Disadvantages
- Requires upfront modeling effort
Selection Guide
If your organization has:
- More than 5 dashboards
- More than 2 teams using data
You need a semantic layer. Period.
6. Implementation
6.1 Setup
Required:
- Snowflake database with curated data
- Defined business KPIs
- Role-based access setup
6.2 Core Build Steps
Step 1 — Identify Core Business Metrics
Stop guessing. Talk to stakeholders.
Step 2 — Define Standard Logic
Example:
Revenue = TotalCharges - Discounts
Step 3 — Create Semantic Views
CREATE OR REPLACE VIEW SEMANTIC.SALES_METRICS AS
SELECT
    CUSTOMER_ID,
    ORDER_DATE,
    (TOTAL_CHARGES - DISCOUNT_AMOUNT) AS REVENUE
FROM CURATED.SALES;
Step 4 — Standardize Naming
Avoid garbage naming like:
tbl_1, data_final_v2
Use:
CUSTOMER_REVENUE, ORDER_METRICS
Step 5 — Restrict BI Access
BI tools should ONLY access semantic layer.
6.3 Configuration Defaults
- One metric = one definition
- Central ownership of semantic models
- No direct access to curated/raw layers
7. Validation & Testing
7.1 Metric Validation
Ensure calculations match business expectations.
7.2 Consistency Testing
Same query → same result across tools.
7.3 Data Accuracy
Cross-check against source systems.
7.4 Human Review
Business teams must validate definitions.
8. Security & Access
- Enforce RBAC at semantic layer
- Restrict raw table exposure
- Audit query access
9. Performance & Cost
Performance
- Use materialized views where needed
- Optimize joins
Cost Drivers
- Query compute
- Storage for derived tables
Cost Controls
- Auto-suspend warehouses
- Avoid redundant metrics
10. Operations & Monitoring
Monitor
- Query usage
- Metric adoption
- Dashboard consistency
Alerting
- Metric mismatches
- Query failures
11. Common Pitfalls
- Treating semantic layer as optional
- Poor naming conventions
- No ownership of metrics
- Allowing direct table access
12. Variations / Use Cases
Variation 1 — BI Semantic Layer
Direct integration with Power BI
Variation 2 — dbt Metrics Layer
Centralized metric definitions
Variation 3 — AI + Semantic Layer
Combine with Cortex for business-friendly querying

Dara Bindara
Associate Data Engineer
Boolean Data Systems
 Dara Bindara is a Associate Data Engineer specializing in building and optimizing cloud-based data pipelines. Experienced in Python, SQL, PySpark, Snowflake Cortex, and AI/ML workflows, with a focus on ETL automation, large-scale data transformation, and scalable data warehousing.
About Boolean Data
Systems
Boolean Data Systems is a Snowflake Premier Partner that implements solutions on cloud platforms. We help enterprises make better business decisions with data and solve real-world business analytics and data challenges.
Services and
Offerings
Follow us on
Solutions &
Accelerators
Global
Head Quarters
USA - Atlanta
3970 Old Milton Parkway,
Suite #200, Alpharetta, GA 30005
Ph. : 770-410-7770
Fax : 855-414-2865